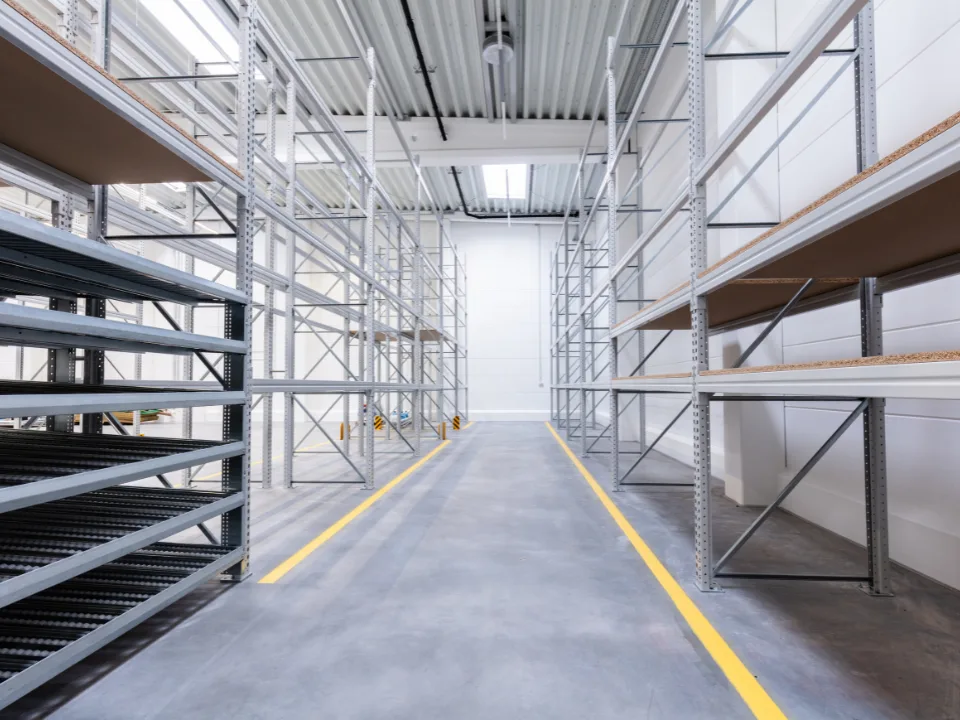
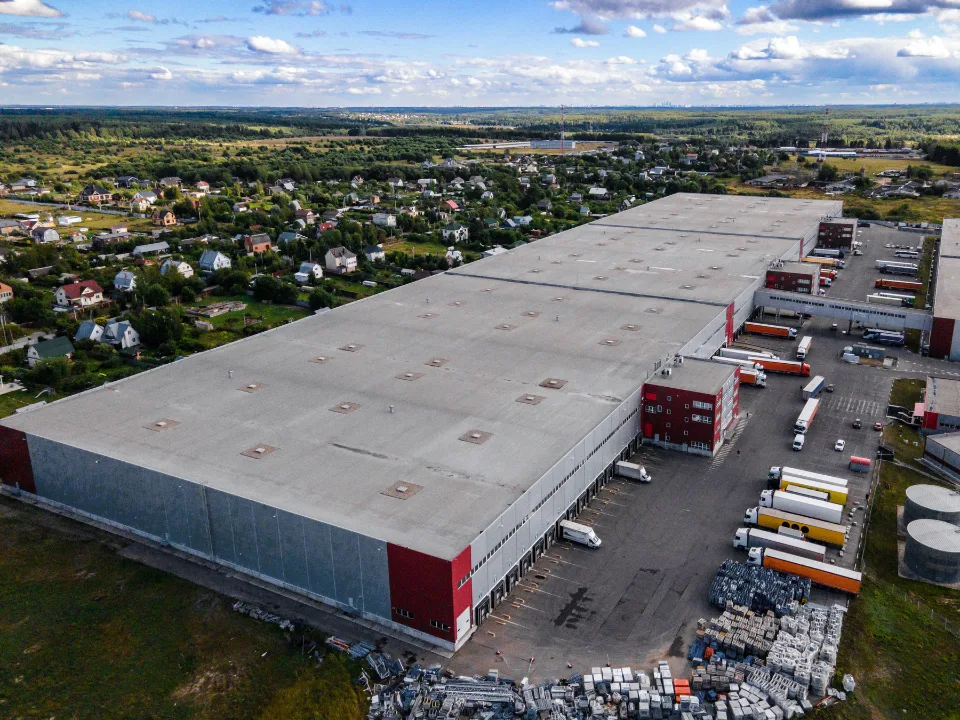
- US industrial vacancy rose to 7.1% in Q1 2025, the highest level since 2015, according to Colliers, signaling the 11th consecutive quarter of increases.
- Supply growth has cooled significantly, with 65M SF delivered in Q1, down sharply from the 2023 peak of 16M SF.
- Vacancy increases are most pronounced in coastal markets like Charleston, while construction starts and pipelines continue to decline across all regions.
A Peak After a Boom
The industrial sector is entering a new phase after years of exceptionally tight market conditions. The national vacancy rate rose to 7.1% during the first quarter of 2025, according to Colliers’ latest report. That’s up 14 basis points from the previous quarter and marks the 11th straight quarter of rising vacancies.
While a rising vacancy rate typically signals weakening demand, this cycle looks different. The pace of vacancy growth is slowing compared to the sharp, over-30 basis-point increases seen through 2023. This hints at a market that is gradually finding balance.
Regional Snapshot
Different regions are feeling the effects unevenly. The Midwest posted the lowest vacancy rate at 5.4%, showing it remains one of the healthiest industrial regions in the country.
The West and Northeast, however, saw the largest jumps, up 158 and 128 basis points year-over-year.
In the South, vacancy rates climbed to 8.3%, also reflecting a loosening market.
Coastal markets are seeing the sharpest changes. Charleston, in particular, recorded a 21% vacancy rate— the highest nationally—after a dramatic year-over-year rise of 814 basis points.
Supply-Demand Reset
The wave of new industrial supply is slowing down. Only 65M SF were delivered in the first quarter, marking the lowest quarterly total since 2019. That’s a sharp drop from the 162M SF delivered at the height of the development boom in Q3 2023.
Meanwhile, net absorption totaled 35M SF in Q1, a positive sign that demand remains active even as supply has increased. With 279M SF currently under construction—the lowest pipeline since 2018—Colliers projects that the market could soon reach peak vacancy before starting to tighten again.
Get Smarter about what matters in CRE
Stay ahead of trends in commercial real estate with CRE Daily – the free newsletter delivering everything you need to start your day in just 5-minutes
Where Construction Persists
While national construction is slowing, key metros continue to expand. Dallas/Ft. Worth, Los Angeles, Houston, Atlanta, and Phoenix remain the top markets for industrial building activity.
Dallas/Ft. Worth led all US markets in Q1 absorption with 6.9M SF, showing strong ongoing demand. The Inland Empire absorbed 4.8M SF, while Phoenix took up 4.1M SF. These numbers show that well-located and strategic markets are still performing, even in a slower national environment.
Why It Matters
Despite ongoing economic concerns and uncertainty around tariffs, Colliers expects net absorption to stay positive in 2025. Demand remains resilient, though more moderate compared to the explosive post-pandemic growth.
Warehouse and distribution rents grew by 6% over the past year to an average of $10.65 PSF. Rents are expected to stabilize as vacancy rates peak and supply and demand find a better balance.
Once market conditions firm up, a new development cycle could begin, focusing more on supply-demand equilibrium than rapid expansion.
