


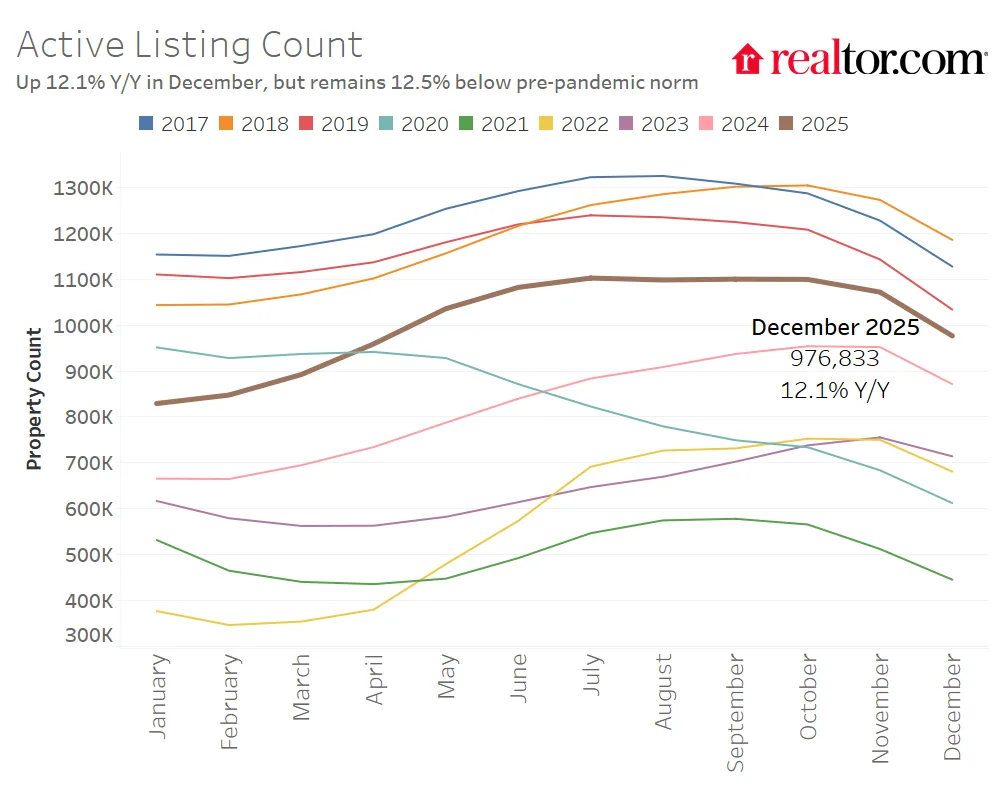
- Housing inventory rose 12.1% year-over-year in December 2025, marking 26 consecutive months of annual gains but remains below pre-pandemic levels.
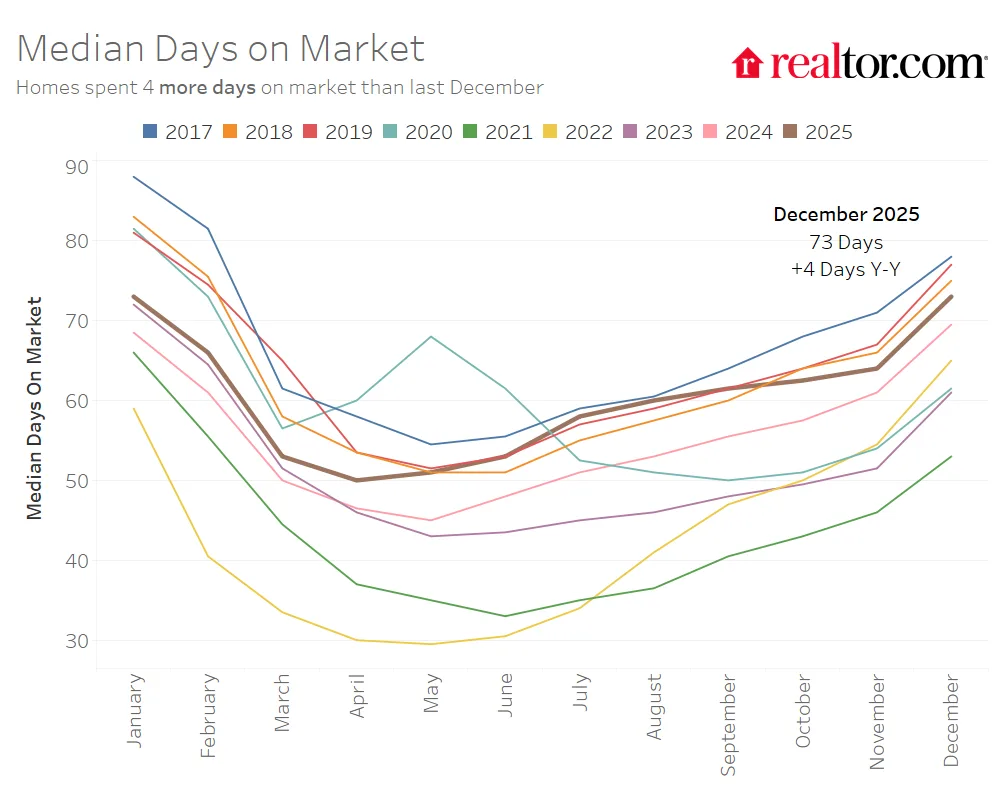
- Median list price fell 0.6% year-over-year, with homes taking 4 days longer to sell compared to last year, pointing to softer demand.
- Price-per-square-foot trends diverged, up 4.1% year-over-year in the Northeast and 1.7% in the Midwest but down in the South and West.
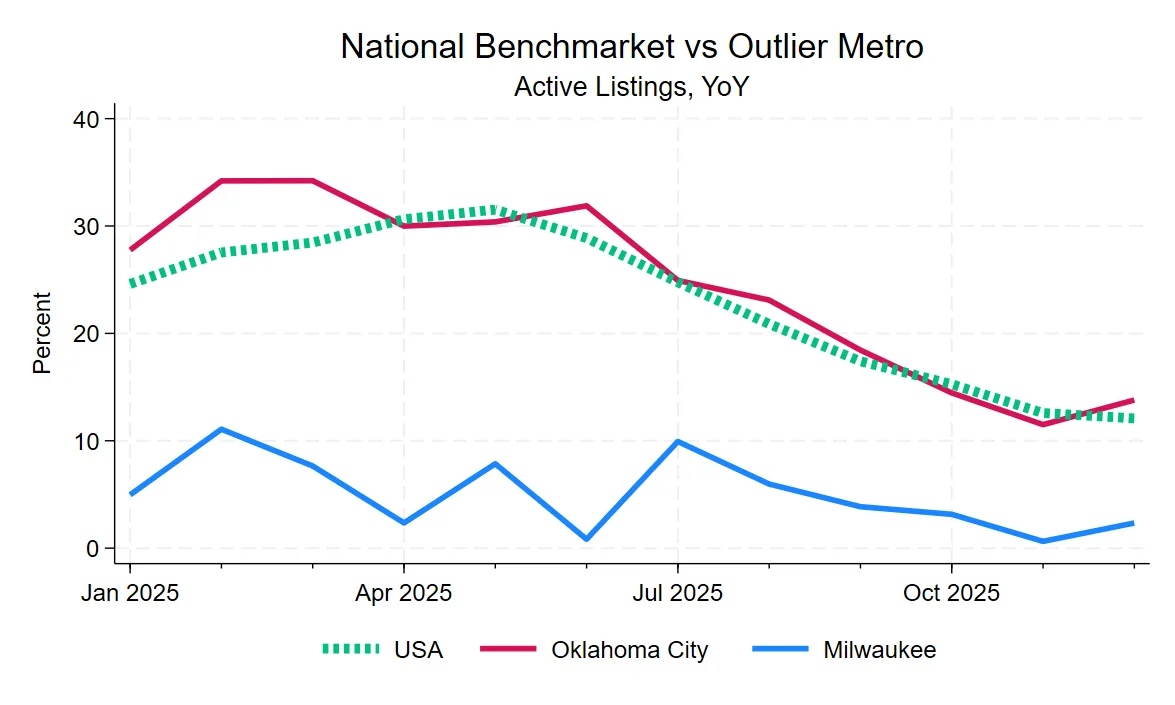
- Regional “benchmarkets” track broader trends closely, while outlier metros, such as Milwaukee and Washington, DC, diverge sharply from the norm.
Inventory Rises, But Growth Slows
According to Realtor, the US housing market closed 2025 with a steady increase in housing inventory—active listings climbed 12.1% year-over-year in December. This marks the 26th straight month of annual inventory growth. However, the pace is slowing, with monthly inventory falling 8.9% in December as part of a usual seasonal downturn. Inventory remains 12.5% below pre-pandemic norms, continuing to reflect historic supply constraints across much of the country.
Shifting Regional Recovery
Housing inventory trends highlighted significant regional differences. The South and West led in recovery: both regions now have active listing counts above pre-pandemic levels, up 4.5% and 1.1%, respectively. The Midwest and Northeast, however, continued to trail; the Northeast’s active inventory remains down 50.4% from pre-pandemic norms. At the metro level, cities like San Antonio and Denver now have more than 40% higher inventories than before the pandemic, while Hartford and Providence stand out for having the largest deficits.
Get Smarter about what matters in CRE
Stay ahead of trends in commercial real estate with CRE Daily – the free newsletter delivering everything you need to start your day in just 5-minutes
Demand Softens, Prices Ease
Demand cooled further in December, with the national median list price declining 0.6% from the previous year to $399,950. Homes took 73 days on average to sell—4 days longer than in December 2024. Regionally, prices per square foot grew the most in the Northeast (+4.1%) and Midwest (+1.7%), but dropped in the South (-2.3%) and West (-1.4%), underscoring divergent regional demand and supply fundamentals.
Benchmarkets vs. Outliers: New Ways to Interpret the Data
In 2025, “benchmarkets”—metros like Pittsburgh and Nashville—mirrored their region’s housing inventory and price trends, providing reliable indicators of broader patterns. Outlier metros, such as Providence and Washington, DC, diverged significantly, moving against regional trends either due to faster growth, unique supply factors, or regional economic shifts. Oklahoma City closely matched national averages, while Milwaukee stood out as a market where price-per-square-foot trends and supply dramatically differed from the US baseline.
What’s Next
Looking ahead to 2026, Realtor.com projects further supply improvement and gradual demand normalization, with modest growth in inventory and a steadying of prices. Analysts and market participants are urged to look beyond headline numbers to understand “benchmarkets” and outlier dynamics as regional and metro-level differences will likely keep shaping the US housing market narrative. Recent fluctuations in new construction activity may also influence how quickly inventory levels can rebound in early 2026, especially in markets still facing persistent supply deficits.