


- Apartment occupancy and rents in the US both increased slightly in January and February 2026.
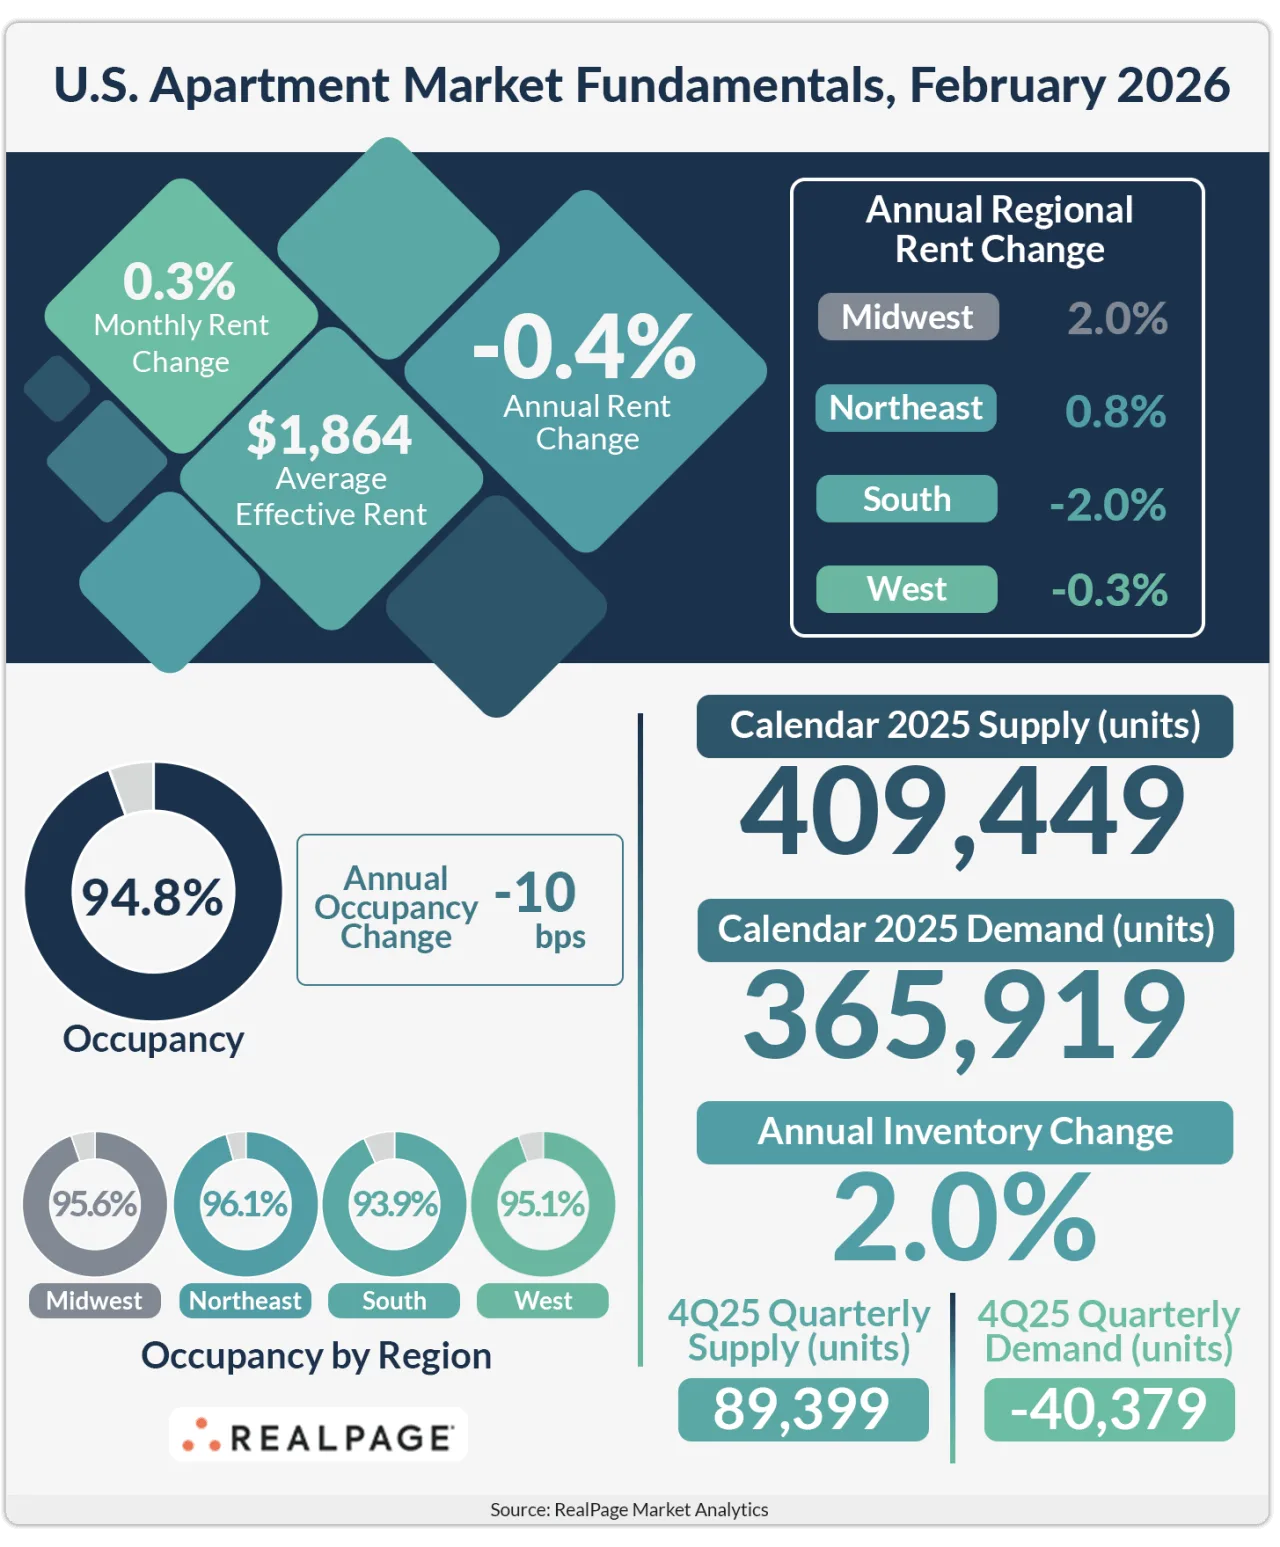
- February occupancy reached 94.8%, up 20 bps year-to-date, but remains below 2025 levels.
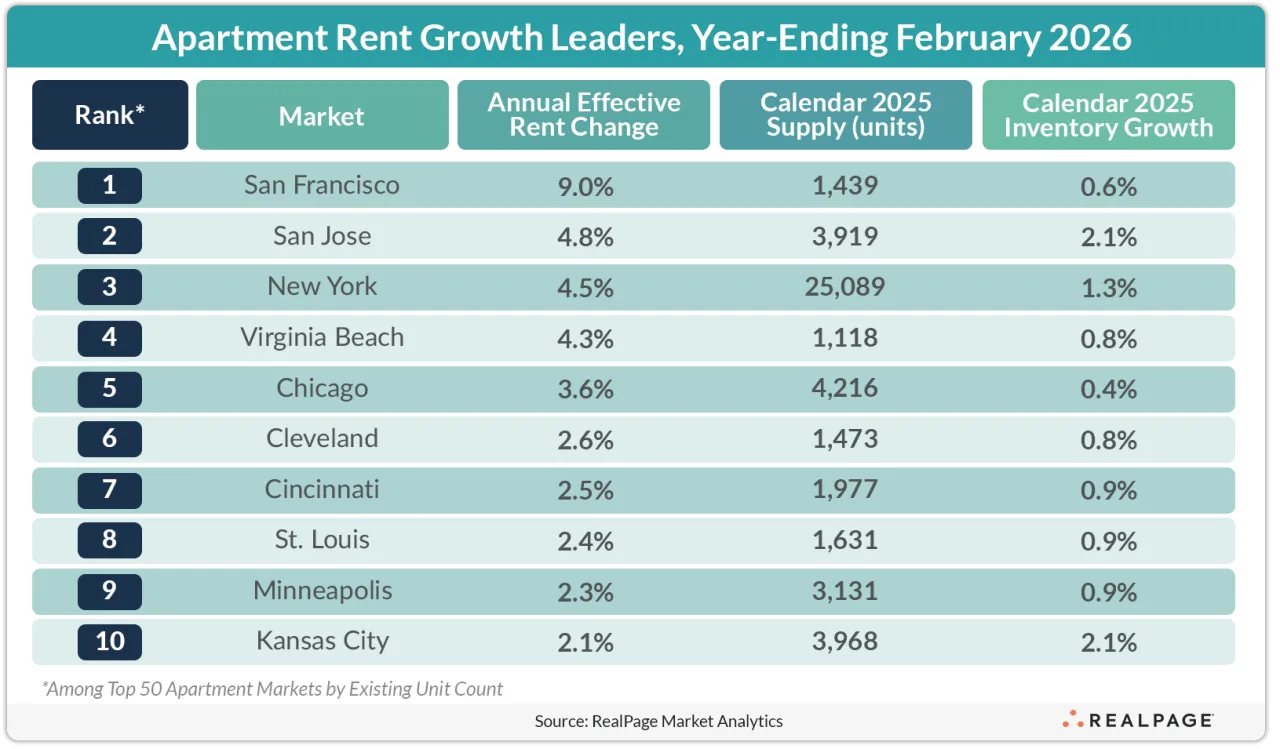
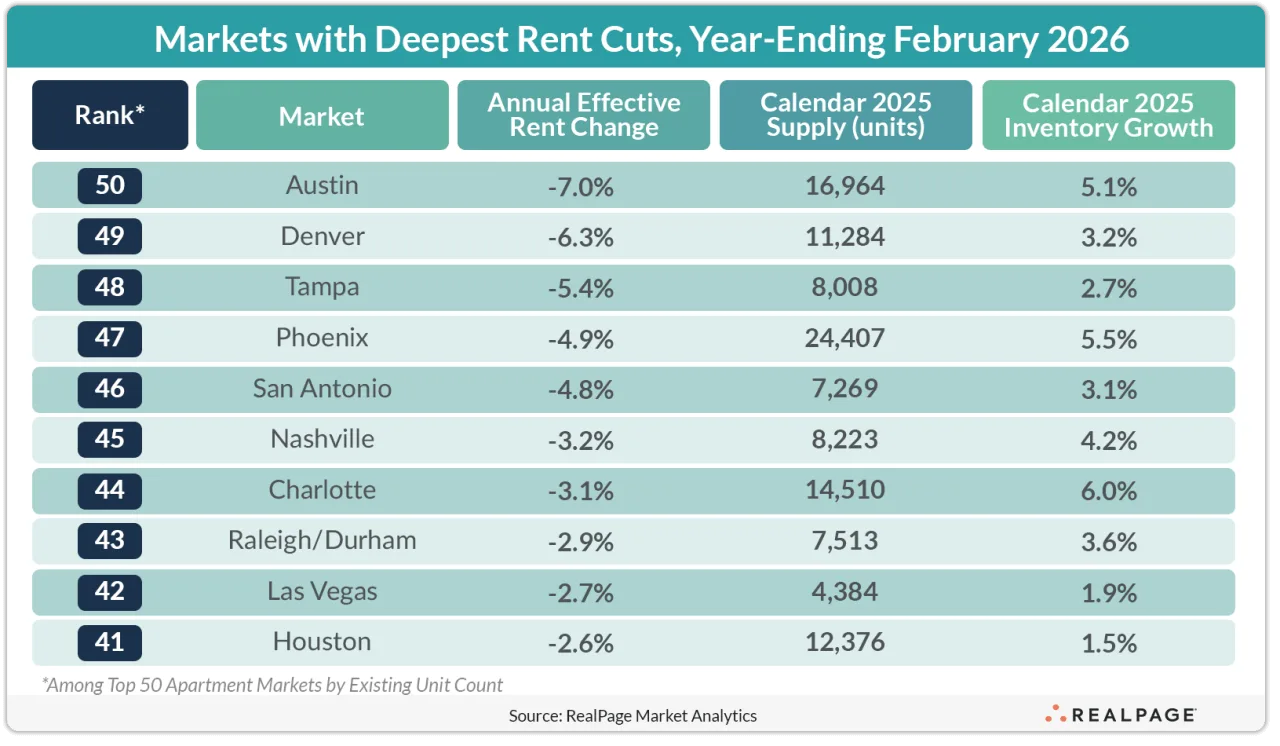
- Rent growth was concentrated in tech hubs, while Sun Belt and tourism markets saw continued declines.
- Annual effective rents remain 0.4% below February 2025, despite recent monthly gains.
Occupancy and Rent Growth Return
For the first time in two years, apartment occupancy and effective asking rents both rose in two consecutive months. According to RealPage Market Analytics, US occupancy hit 94.8% in February 2026 after mild 10 basis point gains in January and February. Effective asking rents also increased 0.3% over January, continuing momentum seen at the start of the year.
Annual Comparison Still Negative
Despite recent gains, occupancy rates remain 10 bps below February 2025 and 90 bps beneath the April 2025 peak. Similarly, while rents edged up monthly, February’s average was still 0.4% below year-earlier levels, reflecting the lasting effect of 2025’s declines.
Get Smarter about what matters in CRE
Stay ahead of trends in commercial real estate with CRE Daily – the free newsletter delivering everything you need to start your day in just 5-minutes
Regional Gaps Widen
Apartment occupancy and rents showed stark differences by region. The nation’s South and West continued to post the sharpest annual rent reductions, driven by elevated new supply and operators prioritizing occupancy. Markets including Austin, Denver, Phoenix, and Charlotte saw the deepest rent cuts, alongside tourism-oriented markets like Tampa and Las Vegas. The uneven performance across markets comes as broader commercial real estate activity has also begun to rebound this year, with transaction volumes picking up across several property sectors.
Tech Markets Outperform
Tech-centric coastal cities were the notable exception, with San Francisco, San Jose, and New York posting annual rent growth from 4.5% to 9%. Renter demand fueled by tech job growth and AI sector expansion supported these gains, and Midwest cities such as Chicago and Minneapolis also recorded strong rent increases.