


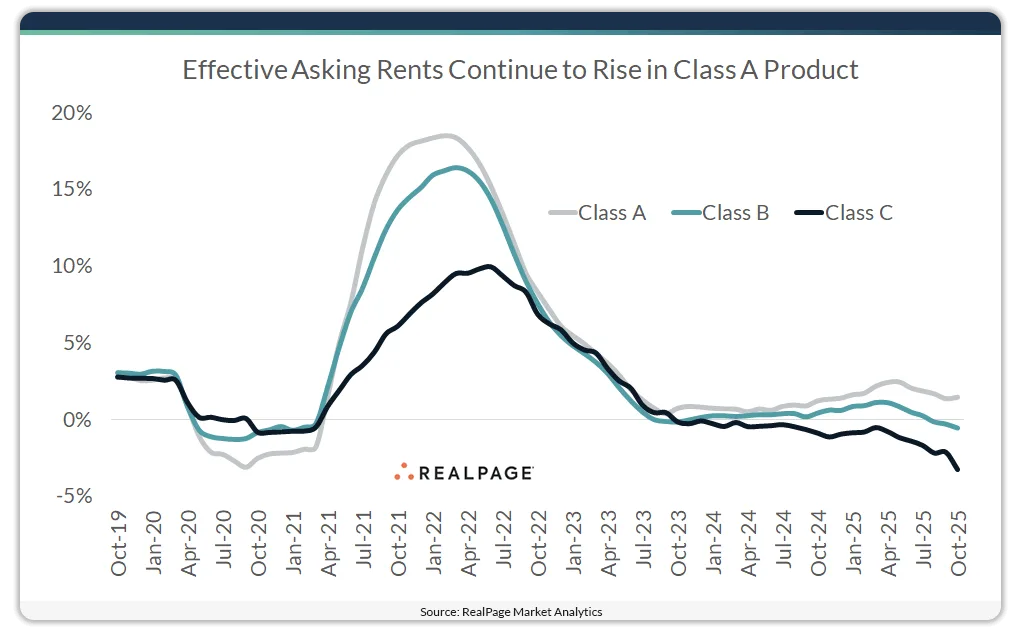
- Class A apartments saw 1.4% rent growth year-over-year, despite an influx of new supply and softer occupancy compared to Class B and C.
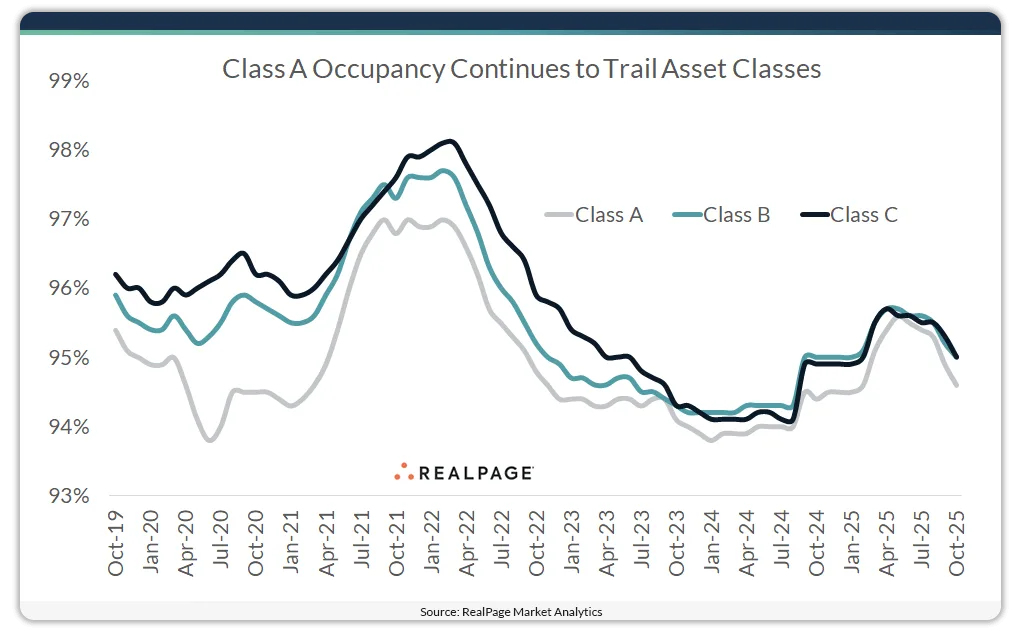
- Class B and C assets posted higher occupancy (95%) in October, outperforming Class A’s 94.6%, though all remain near pre-pandemic norms.
- Class C rents dropped 3.2% year-over-year, the steepest cut in nearly 14 years, while Class B rents declined 0.6%.
Demand Holds Strong Amid Supply Pressure
Despite sustained delivery of new multifamily units across the US, demand for apartments remains robust. RealPage Market Analytics reports that stabilized, market-rate rentals continue to attract renters at levels well above historical averages. However, elevated supply has tempered overall occupancy gains and pressured rents — especially in the lower-tier asset classes.
Occupancy: A Class Divide
In October 2025, Class B and C assets outpaced Class A in occupancy, each hitting 95%. While slightly below pre-pandemic averages (95.3% for Class B and 95.4% for Class C), these figures still reflect solid demand. Class A units, meanwhile, recorded a 94.6% occupancy rate — essentially flat with their pre-pandemic average of 94.7%.
Still, Class A product saw the biggest year-over-year occupancy increase, climbing 20 basis points compared to 10 basis points for Class C, and no change for Class B. That upward movement aligns with broader patterns seen in recent multifamily performance across top-tier assets nationwide.
Rent Trends Diverge by Class
Elevated supply took a toll on national rent growth, which fell 0.7% year-over-year — the sharpest annual decline in over four years. The dip was led by steep losses in Class C, where effective asking rents fell 3.2%, the deepest cut for that segment since 2011. Class B also saw a decline of 0.6%.
Class A, however, bucked the trend. Rents in this segment rose 1.4% annually, extending a 55-month streak of year-over-year increases. Though below the pre-pandemic average of 3.1% (2015–2019), this growth highlights the pricing power that still exists at the top of the market.
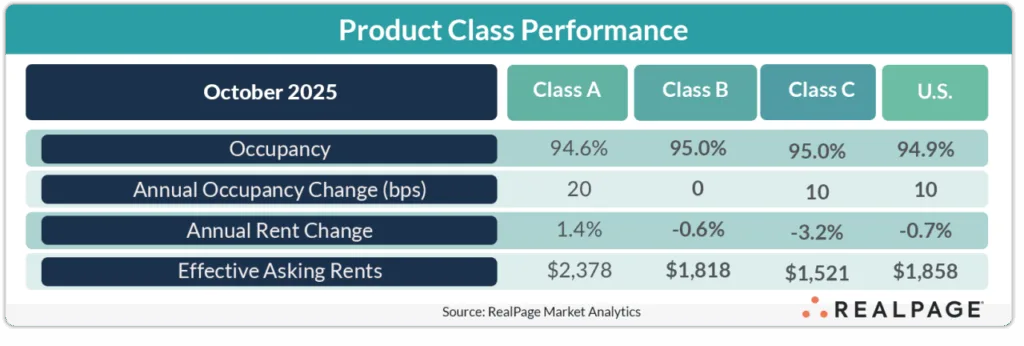
By the Numbers
- National average rent (Oct. 2025): $1,858
- Class A average rent: $2,370
- Class B average rent: $1,818
- Class C average rent: $1,521
Class A continues to command a significant premium — $560 more per month than Class B — even as its occupancy slightly trails.
What to Watch
While Class A continues to show resilience, ongoing deliveries may test rent growth into 2026. Meanwhile, the affordability pressures in Class B and C segments could maintain high occupancy, though rent growth may remain muted. Developers and investors should keep an eye on shifting demand patterns as the market works through its current supply wave.
Get Smarter about what matters in CRE
Stay ahead of trends in commercial real estate with CRE Daily – the free newsletter delivering everything you need to start your day in just 5-minutes