


- Over 22.2M US renter households now spend more than 30% of income on rent.
- Cost burden rates have increased in 49 of the 50 largest metro areas since 2019.
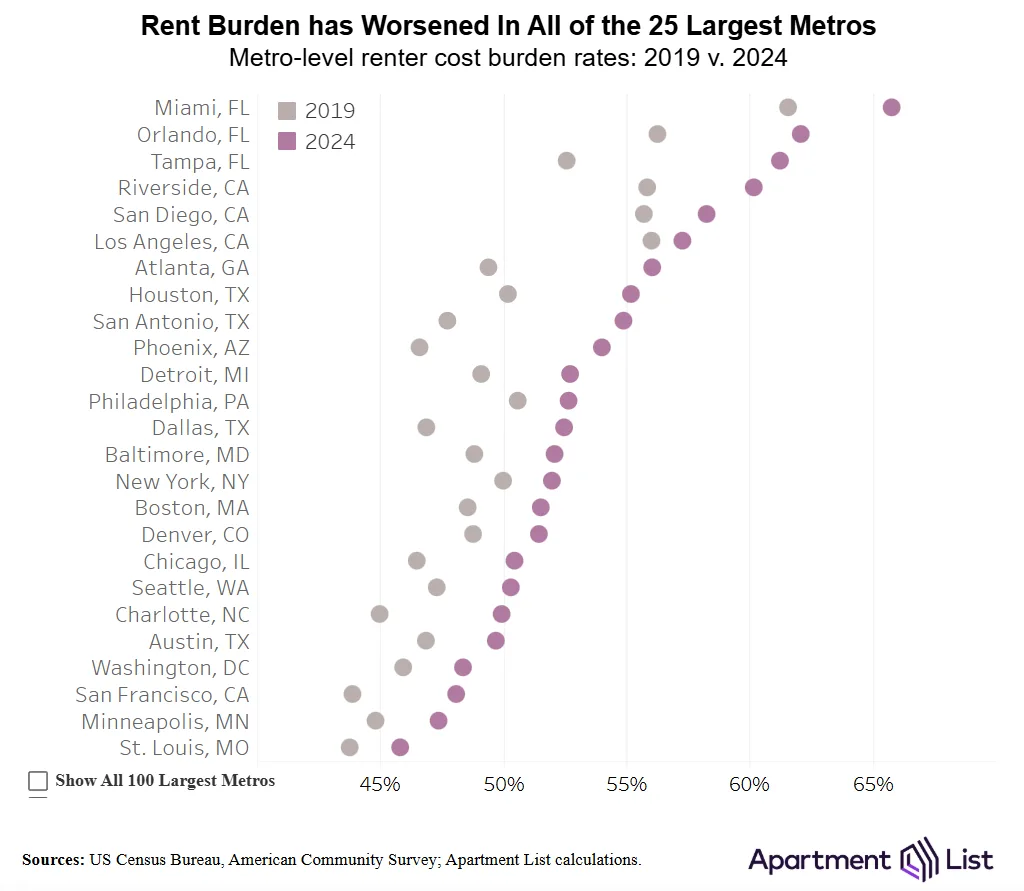
- Florida leads the nation, with Miami, Orlando, and Tampa showing the highest rates.
- Rent growth continues to outpace income growth in most major metro markets.
Renter Cost Burden Reaches New Highs
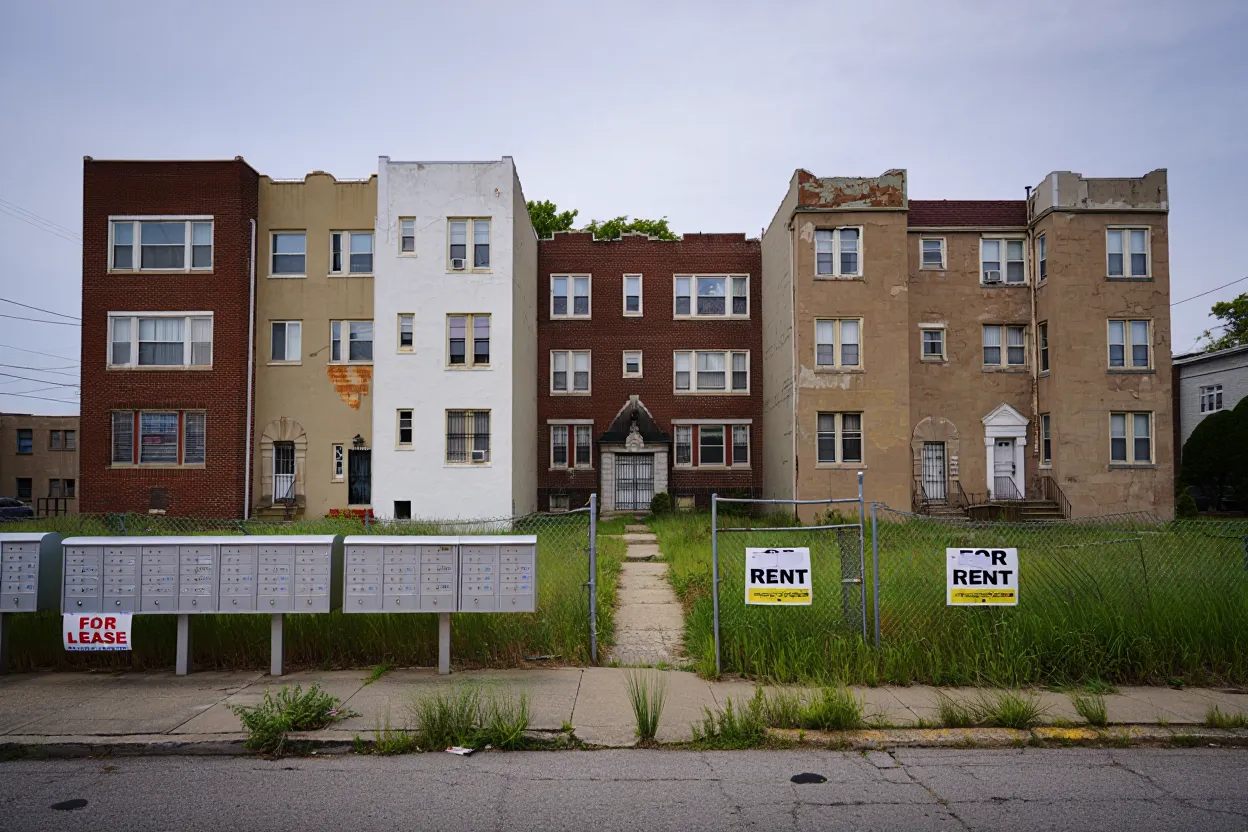
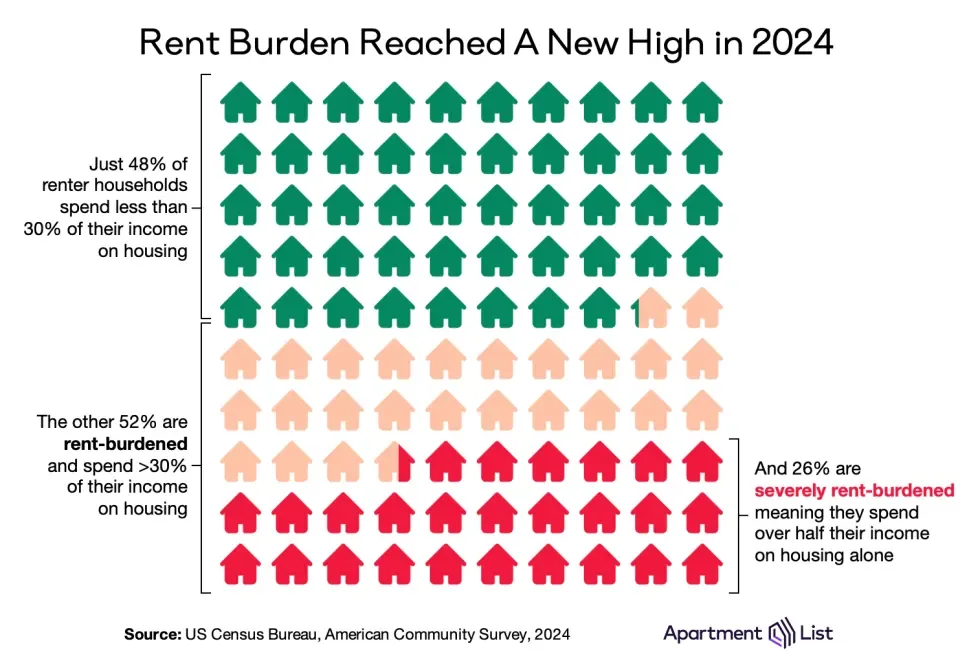
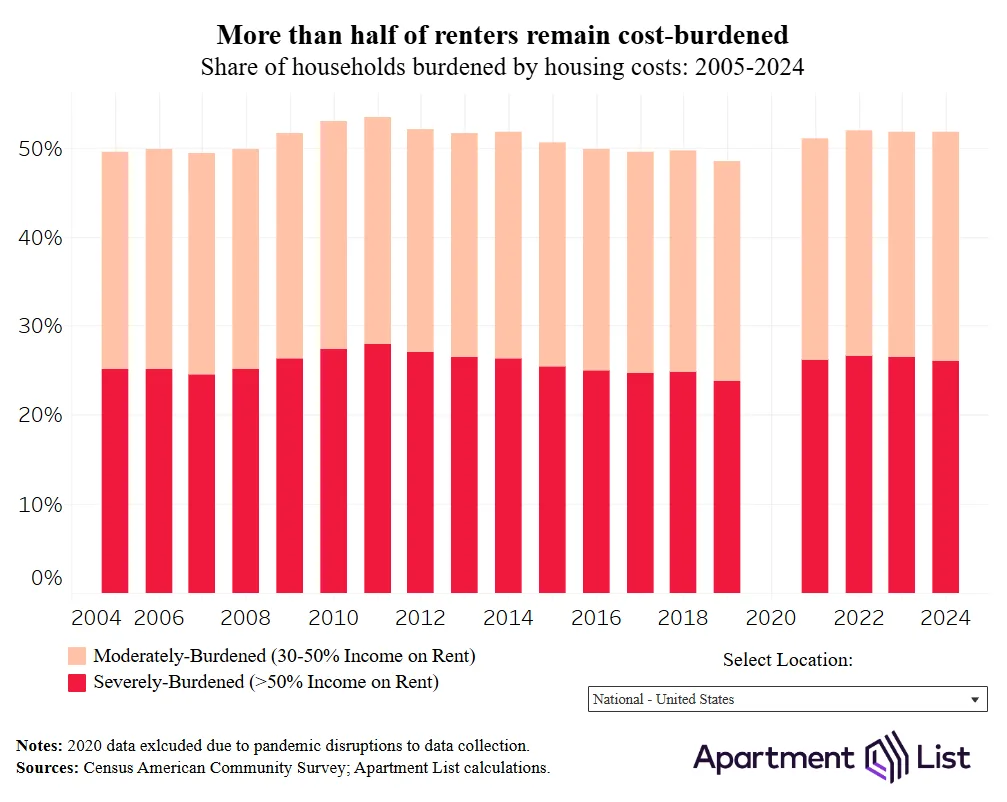
The Apartment list reports that the share of cost burdened renters in the US has reached an unprecedented level, with 22.2M households—51.8% of all renters—now spending over 30% of their income on rent. This trend persists even as rents have cooled from recent peaks. Severely cost-burdened renters, those paying over half of their income towards rent, now make up 11.2M households nationwide.
Widespread and Deepening Affordability Crisis
Cost burden rates worsened from 2019 to 2024 across nearly all major metro areas, erasing years of improvement during the last decade. Tampa saw the largest jump among the top 25 metros, with its cost burden rate rising from 52.6% to 61.2%—mirroring rapid rent growth in the Sun Belt and coastal regions. Even in metros with lower median rents, such as Pittsburgh and St. Louis, nearly half of renter households remain cost-burdened. As housing costs take up a larger share of income, many households have less money for essentials like groceries, transportation, and healthcare. Rising rent pressures are also reshaping how Americans allocate their overall spending.
Regional Disparities and Growth in the Sun Belt
Florida is the state most affected by renter cost burden, with 62.1% of renters classified as cost-burdened and Miami leading all US metros at 65.8%. California holds the highest count of cost-burdened renters but sees slightly lower rates compared to Florida, while some Midwest and Mountain West metros, like Pittsburgh and Minneapolis, maintain comparatively lower rates. However, affordability challenges remain significant nationwide.
Rent Growth Outpacing Incomes
In 85 out of the 100 largest US metros, median rents have grown faster than renter incomes since 2019. The gap is most extreme in metros like Tampa, where median rents jumped 53% while wages rose only 34% over five years. The persistence of cost burden pressures signals that recent softening in rents has not translated into improved affordability. New housing supply, often priced at the higher end, does little to address the needs of lower-income renters.
What’s Next
With a record number of cost-burdened renter households and widespread increases across all major US markets, the renter cost burden crisis is set to remain a central affordability challenge. Policymakers and industry stakeholders face mounting pressure to devise effective interventions as rent and wage dynamics continue to diverge.
Get Smarter about what matters in CRE
Stay ahead of trends in commercial real estate with CRE Daily – the free newsletter delivering everything you need to start your day in just 5-minutes