


- CRE prices rose again in October, marking five straight months of gains, per CoStar’s latest repeat-sales index report.
- Investment-grade assets led the recovery, with prices up 2% year-over-year, and deal volume up nearly 11% month-over-month.
- Total repeat sales hit $13.5B in October, a 16% jump compared to the previous year, reflecting renewed investor interest as borrowing costs drop.
A Gradual Climb: US CRE Prices Extend Recovery
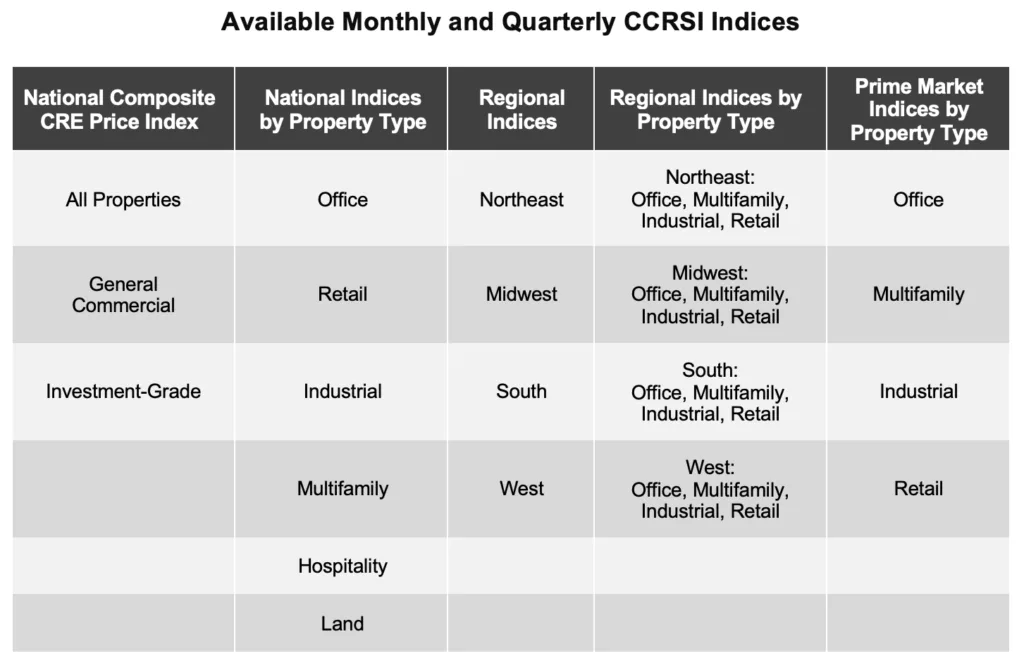
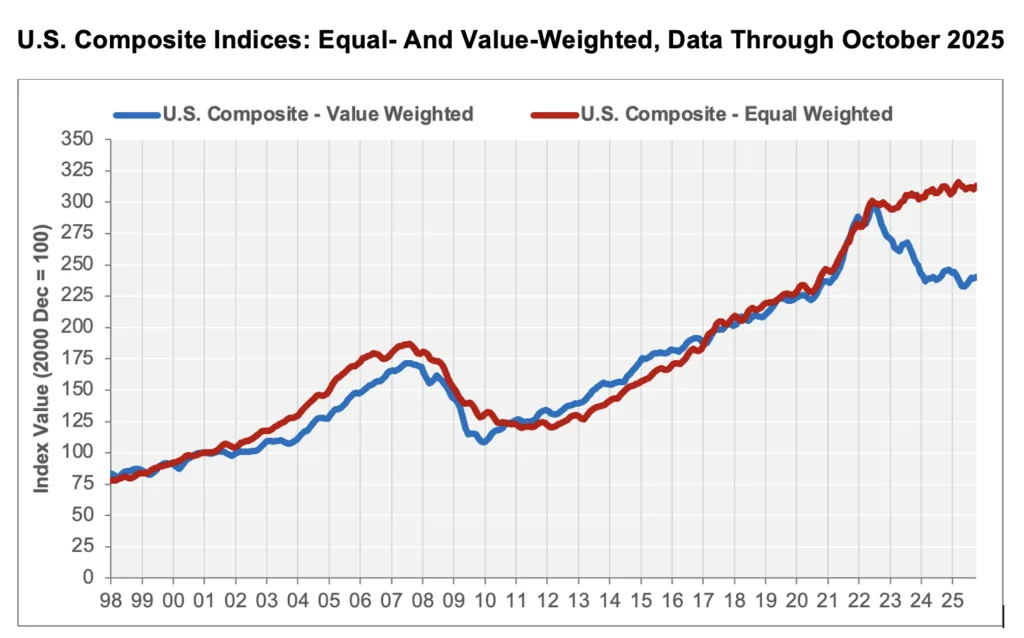
US commercial real estate prices rose in October for the fifth time in as many months, according to CoStar’s October 2025 Commercial Repeat-Sale Indices (CCRSI) report. Analysts say the consistent monthly gains signal a stabilization phase after a prolonged downturn, helped by improving capital markets and rate cuts from the Federal Reserve.
The value-weighted index, tracking higher-value transactions mostly in core markets, rose 0.5% month-over-month. Meanwhile, the equal-weighted index — which reflects smaller, more frequent deals in secondary markets — posted a 0.9% gain. That marks the third monthly increase in four months for this index.
Investor Confidence Returning
The CRE market has benefited from two Fed rate cuts since September, which lowered borrowing costs to their lowest levels since 2022. As a result, deal activity accelerated. “Improving deal flow and stabilizing values may encourage investors waiting on the sidelines to become more active,” said Chad Littell, CoStar’s national director of capital markets analytics. Recent momentum has been visible across the transaction pipeline, with October seeing a noticeable uptick in deal activity across key commercial sectors.
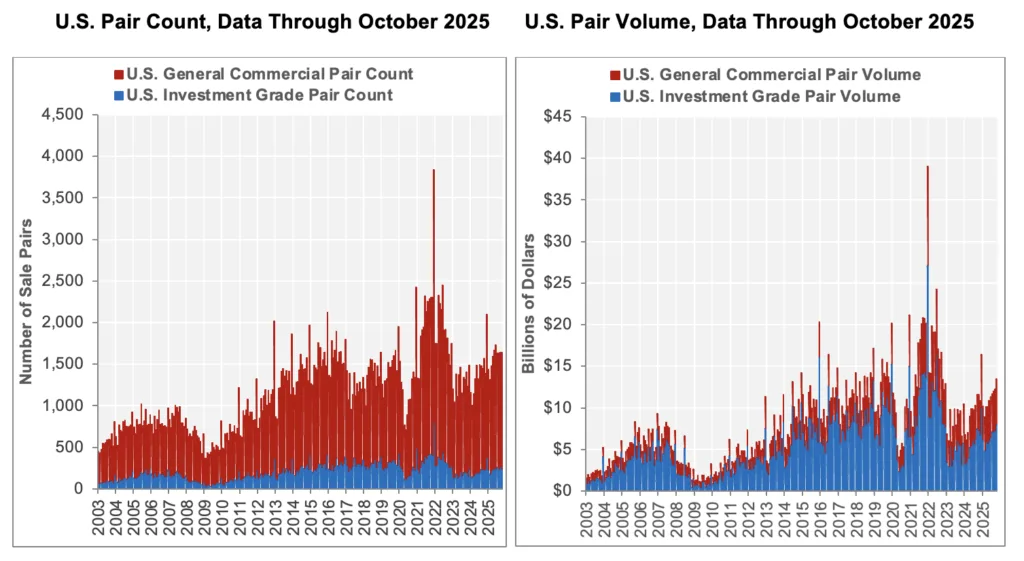
The number of repeat sales in October reached 1,640, totaling $13.5B — up 16.3% year-over-year. Investment-grade sales made up $8.1B of that total, a 10.9% increase from September. These assets, typically large properties in primary or secondary markets, are leading the broader pricing recovery.
Momentum Builds in Investment-Grade Segment
The investment-grade index rose 0.3% month-over-month and 2% year-over-year. Over the last 12 months, this segment’s sales volume surged by nearly 30% to account for 60% of all repeat-sale volume.
In contrast, the general commercial sub-index — tracking smaller properties — increased 0.9% in October but remains 0.2% below its October 2024 level. Overall, the equal-weighted composite index is still 0.9% below its March 2025 peak.
More Deals, Less Time on Market
With more investors re-entering the market, listings are selling faster. The average time a property spent on the market fell to 173 days, a 0.9% decline from a year ago. However, the sale price-to-asking-price ratio dropped to 92.1%, and a higher percentage of sellers (28%) withdrew listings, suggesting some ongoing pricing mismatches.
Get Smarter about what matters in CRE
Stay ahead of trends in commercial real estate with CRE Daily – the free newsletter delivering everything you need to start your day in just 5-minutes
Distress Still Limited
Distressed transactions remained relatively low, with only 2% of October’s repeat sales falling into that category — mostly in the general commercial sector.
Why It Matters
After three years of market headwinds, rising sales volume and stabilizing prices suggest that US commercial real estate could be on firmer footing heading into 2026. Still, prices remain well below peak levels from mid-2022, particularly in the office and multifamily sectors.
What’s Next
With the Fed signaling a pause or potential further cuts, and liquidity returning to the market, analysts expect transaction activity to rise. But while the worst may be over, a full recovery will likely take time — especially in lagging property sectors and markets still adjusting to post-pandemic dynamics.