


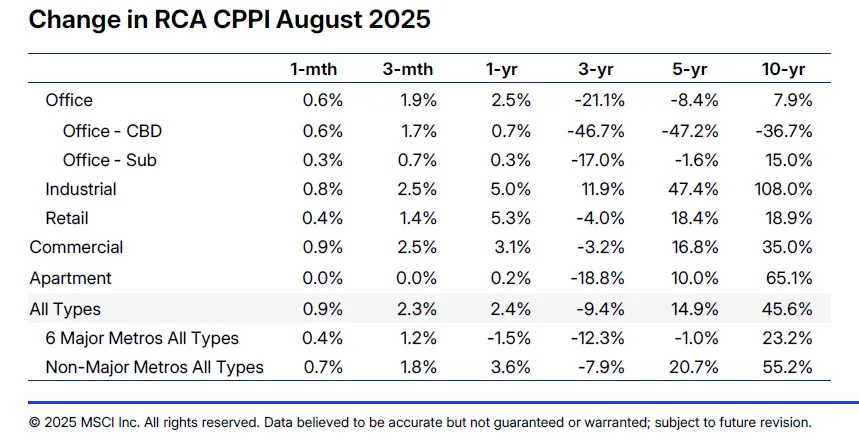
- The RCA CPPI National All-Property Index rose 2.4% year-over-year and 0.9% from July, marking the strongest annual performance since 2022.
- Retail and industrial assets continue to lead, with retail prices up 5.3% year-over-year and industrial up 5.0%, reaching new record highs.
- Apartments and office assets showed marginal improvements, while CBD office prices remain far below pre-pandemic peaks.
CRE Broadly Gains in August
Commercial real estate prices saw broad-based growth in August, led by retail and industrial sectors, per GlobeSt.
The rca cppi All-Property Index climbed 2.4% annually, its fastest rate since late 2022, and 0.9% month-over-month, translating to an 11.1% annualized increase.
Sector Highlights
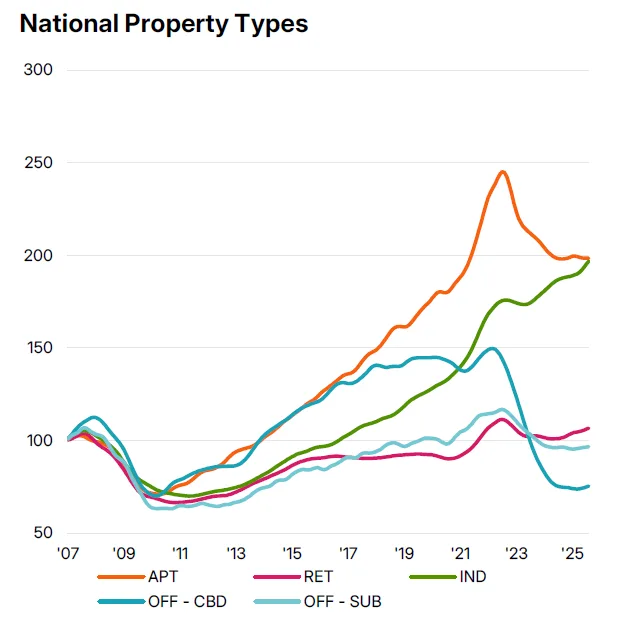
- Retail remained the top performer, rising 5.3% year-over-year and notching its 15th consecutive month of gains. While the pace of growth has moderated since last year, August’s figures still represent double the year-over-year growth rate seen in August 2024.
- Industrial prices hit an all-time high, up 5.0% annually and 0.8% month-over-month, with values regaining upward momentum since April. The August performance was the strongest since December 2024.
- Apartments edged up 0.2% over the year, marking the best annual growth since 2022, though prices were flat from July. Stabilization in this sector is being attributed to the Federal Reserve’s recent rate cut and expectations of further monetary easing.
- Office assets showed mixed results. cbd offices rose 0.7% YOY and 0.6% from July, while suburban offices increased a modest 0.3% on both metrics. Despite these gains, CBD office prices remain nearly 47% below their peak from before the pandemic.
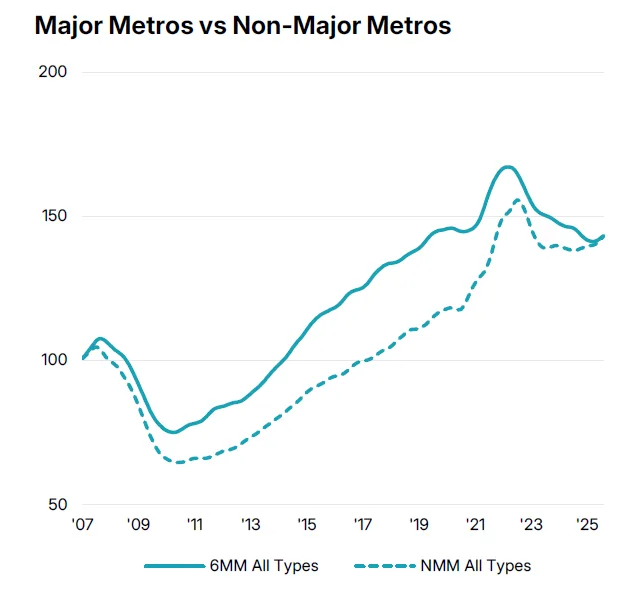
Market Geography: Secondary Cities Outperform
The divide between major metros and smaller markets remains notable. Non-Major Metros (NMM) posted a 3.6% annual increase, while the Six Major Metros (6MM) — New York, Los Angeles, San Francisco, Chicago, Boston, and D.C. — saw a 1.5% decline. Still, the report noted a positive shift in the 6MM, with monthly price growth turning positive since April.
Long-Term Perspective
Over the past 10 years, industrial and apartment properties have led the way in appreciation, rising 108% and 65.1%, respectively. In contrast, CBD office prices have fallen 36.7% over the same period. Retail recorded more modest long-term growth of 18.9%.
Why It Matters
The August report highlights renewed strength in cre prices, particularly in sectors with strong fundamentals like retail and industrial. With interest rates potentially easing further, investor sentiment may continue to improve — especially in segments showing early signs of recovery, such as apartments and offices.
Get Smarter about what matters in CRE
Stay ahead of trends in commercial real estate with CRE Daily – the free newsletter delivering everything you need to start your day in just 5-minutes