


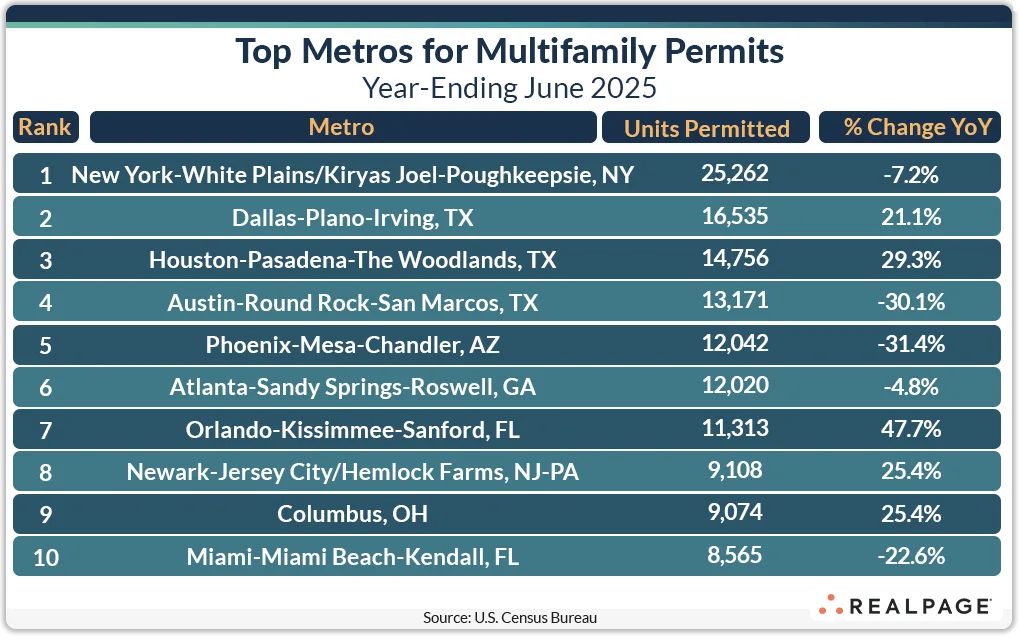
- Top metros hold steady in permit rankings—New York, Dallas, Houston, Austin, and Phoenix lead—but start activity is slowing in most, with only Miami and Houston seeing a quarterly uptick.rn
- Dallas and Houston show increasing momentum, with rising permits and starts, while New York, Austin, and Phoenix decline year-over-year.rn
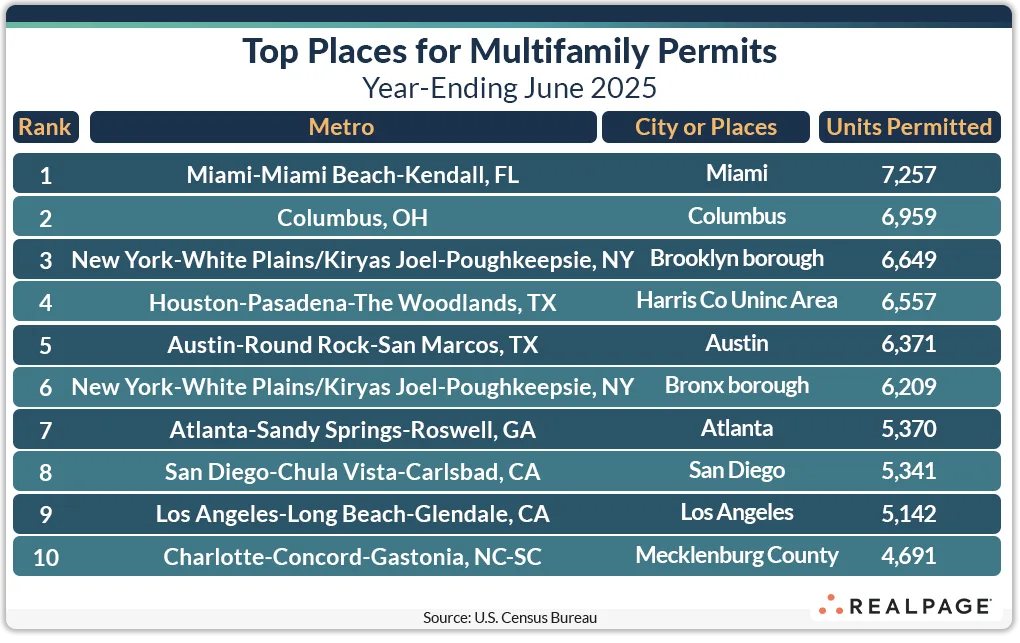
- Miami jumps to #1 in multifamily permitting by city after a 2,500-unit surge in June, despite overall yearly permits remaining down.rn
- Annual apartment starts fell in 8 of the top 10 markets compared to 1Q25, a sign of continued cooling in the sector overall.rnrnrn
Momentum Reshaping the Map
While the top 10 metros for multifamily permitting haven’t seen major shakeups, their growth trajectories have. Dallas and Houston have ramped up activity year-over-year, while New York, Austin, and Phoenix saw significant declines. Columbus, Newark, and Orlando continue to chart mid-tier consistency, with Miami making a notable reappearance at #10.
Yet the broader trend suggests softening. According to RealPage Market Analytics, annual apartment starts dropped in 8 of the top 10 permitting metros between Q1 and Q2 2025. Only Houston and Miami managed quarter-over-quarter increases.
Mixed Signals by Market
Compared to mid-2024, New York’s apartment starts fell by nearly 8,000 units. Columbus, Newark, Austin, Phoenix, and Atlanta posted drops between 2,900 and 7,200 units. Dallas and Houston, meanwhile, showed resilience with increased starts and continued permitting growth.
Miami stood out with a sharp month-over-month permitting increase—up more than 1,500 units in June alone—and annual starts rising both quarter-over-quarter (+1,186 units) and year-over-year (+2,471 units).
Get Smarter about what matters in CRE
Stay ahead of trends in commercial real estate with CRE Daily – the free newsletter delivering everything you need to start your day in just 5-minutes
Permitting Activity: Up in Some, Down in Others
Half of the top 10 permitting metros increased their year-over-year totals by an average of 2,700 units, while the other half fell by an average of 3,250 units.
Biggest YOY permitting drops:
- Washington, DC: -3,805 units
- Los Angeles: -2,981 units
- Tampa: -2,923 units
- San Jose: -2,549 units
- Minneapolis-St. Paul: -2,125 units
Biggest YOY permitting gains:
- Chicago: +2,434 units
- Des Moines: +1,862 units
- Fayetteville-Springdale-Rogers, AR: +1,624 units
- Detroit: +1,551 units
- Bridgeport-Stamford-Danbury, CT: +1,494 units
- Anaheim: +1,317 units
Permitting by Place: Miami Surges to the Top
On the city level, Miami took the #1 spot for annual multifamily permits, climbing from #7 in May after a one-month surge of nearly 2,500 units. Columbus remained steady at #2, while Brooklyn slipped to #3. Unincorporated Harris County (Houston) moved up to #4, pushing Austin down to #5.
Other top 10 permitting places in June include:
- The Bronx
- Atlanta
- San Diego
- Los Angeles
- Mecklenburg County (Charlotte)
Of note, many major metro areas—Dallas, Houston, Phoenix, Newark, Orlando—didn’t see their central cities in the top 10 for permitting places, despite strong metro-level performance.
Why It Matters
Although total permitting levels remain strong in several core markets, the dip in starts across most major metros signals that developers may be pulling back amid ongoing cost, financing, or demand challenges. Yet the strength in select sun belt markets—particularly Houston, Dallas, and Miami—suggests there are still pockets of opportunity in multifamily development.
What’s Next
With permitting and starts diverging in many metros, the second half of 2025 will test whether markets like Houston and Miami can sustain momentum—or if national headwinds will bring more widespread slowdowns. All eyes will be on permitting activity in late Q3 and Q4 for signs of stabilization or further retreat.