


- Renting is cheaper than owning with a mortgage in every major US metro.
- Homeowners pay a median of 36.9% more monthly than renters, a $548 gap.
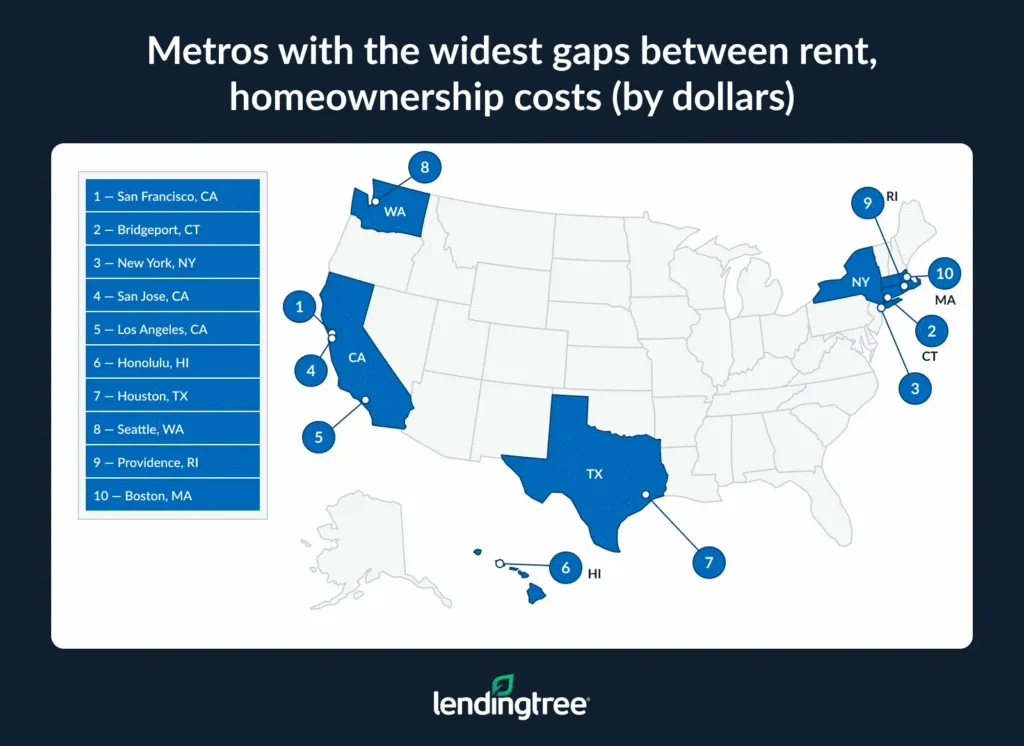
- San Francisco, Bridgeport, and New York show the largest rent-own cost differences.
- In 22 of the 100 largest metros, owning costs over 50% more per month than renting.
Renting Surpasses Buying Across US Metros
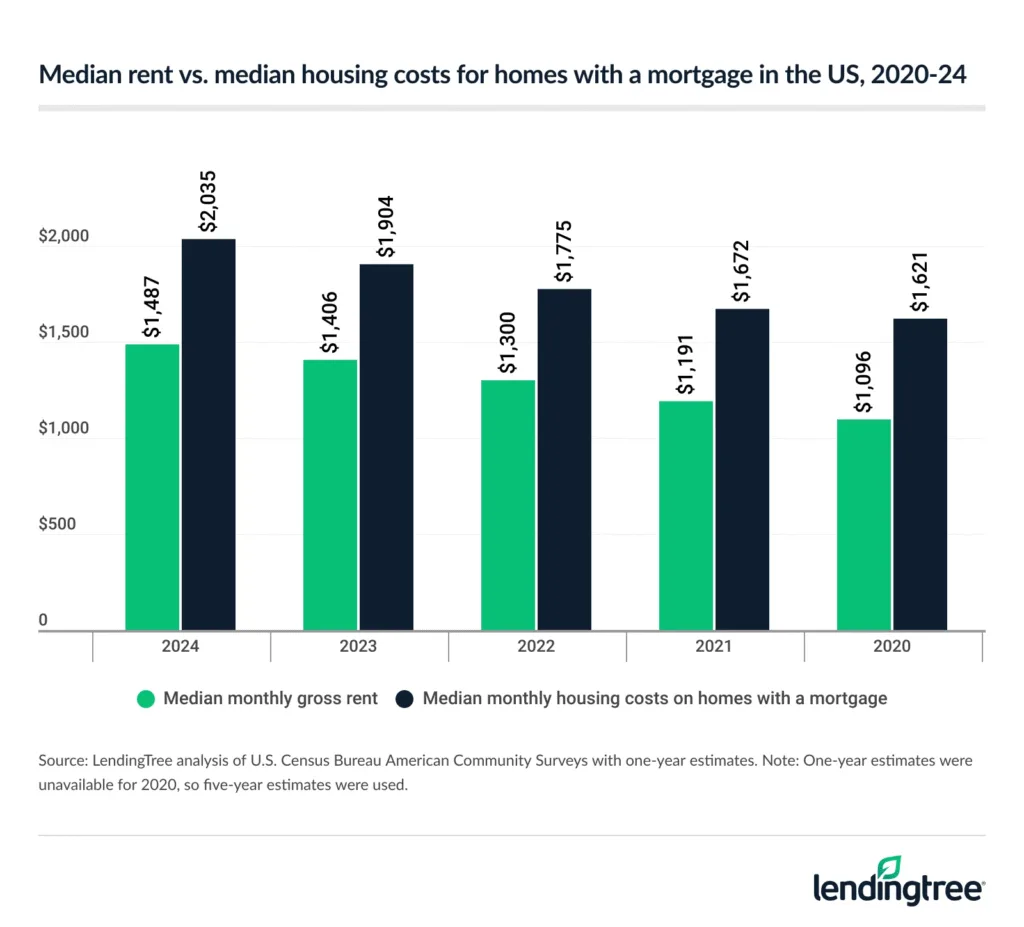
For the first time, rental housing costs consistently fall below homeownership with a mortgage in all 100 largest US metros, according to recent LendingTree analysis. In 2024, median monthly rent reached $1,487, while homeowners with mortgages faced median costs of $2,035—a $548 monthly difference, up $50 from 2023.
This rising gap reflects higher housing prices and mortgage rates, making homeownership less financially accessible for many. While the homeownership route has traditionally been viewed as a pathway to wealth, the current economic climate is amplifying cost pressures for prospective buyers.
Cost Gaps Widen in Major Metros
The divide between rental housing costs and homeownership is most pronounced in major coastal cities. San Francisco tops the list with a $1,565 monthly differential, followed by Bridgeport, CT ($1,427), and New York City ($1,409). Even metros with the smallest cost gaps, like Phoenix and Orlando, see renters paying at least $184 per month less than those with mortgages.
- Top metros by dollar gap: San Francisco ($1,565), Bridgeport ($1,427), New York ($1,409)
- Smallest gap: Phoenix ($184 per month)
Percentage Differences Highlight Affordability Challenges
When measured by percentage, the difficulty of affording homeownership is stark. In New York, homeowners pay 76.1% more than renters. Twenty-two large metros see owners paying at least 50% more. This trend may cause more households to delay or even forgo homeownership, potentially impacting long-term market dynamics and local economies.
- Largest % gap: New York (76.1%), Bridgeport (75.3%), Providence (66.5%)
- Smallest % gap: Phoenix (10.1%), Orlando (13.7%), Cape Coral (14.9%)
Why It Matters
These findings underscore persistent affordability hurdles in the US rental housing market. For multifamily investors, continued rental demand may support occupancy even as aspiring buyers stay on the sidelines. Recent analyses show that homeownership remains out of reach for many renters, even as prices stabilize in some regions, reinforcing a longer-term shift in housing behavior. Households choosing between renting and buying should evaluate their financial goals, savings, and market timing carefully, as the cost gap may influence both individual decisions and broader CRE trends moving forward.
Get Smarter about what matters in CRE
Stay ahead of trends in commercial real estate with CRE Daily – the free newsletter delivering everything you need to start your day in just 5-minutes