


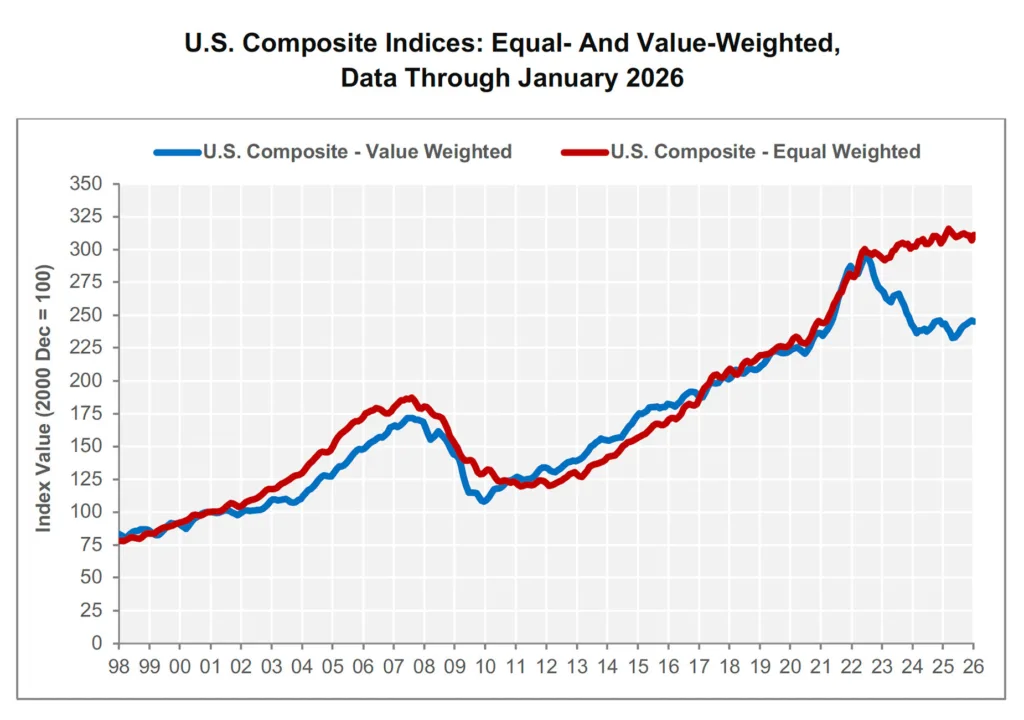
- Small town commercial property prices increased 1.3% in January 2026, beating gains in big city assets.
- Major city, investment-grade property values are 17% below their 2022 peak and declined 0.4% in January.
- Total US commercial repeat-sale deal volume jumped nearly 20% year-over-year to $146.8B.
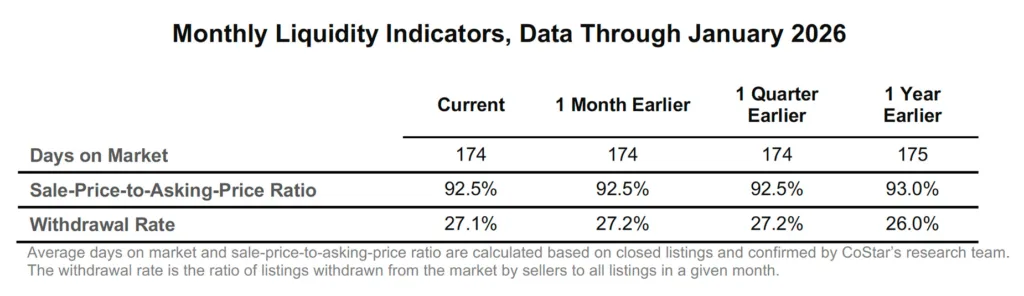
- Buyers secured greater discounts, with price-to-asking ratios falling to 92.5% in January 2026.
Diverging Trends Emerge
Commercial real estate prices in the US moved in opposite directions in January 2026, according to new CoStar data. Secondary and tertiary markets, often comprised of small town commercial assets, outperformed large urban investment-grade properties, which continued to decline in value.
Small Town Commercial Markets Gain Ground
The equal-weighted CoStar index—tracking the numerous, lower-priced deals typical in smaller towns—rose 1.3% in January and 1.1% annually. In contrast, the value-weighted index, heavily influenced by high-value, major market properties, declined 0.4% in January and is now 17% below its mid-2022 peak. The general commercial segment, which captures small town commercial transactions, led growth with a 2.6% annual increase, even as broader forecasts suggest the overall CRE recovery may stretch into 2027.
Get Smarter about what matters in CRE
Stay ahead of trends in commercial real estate with CRE Daily – the free newsletter delivering everything you need to start your day in just 5-minutes
Transaction Activity and Discounts Shift
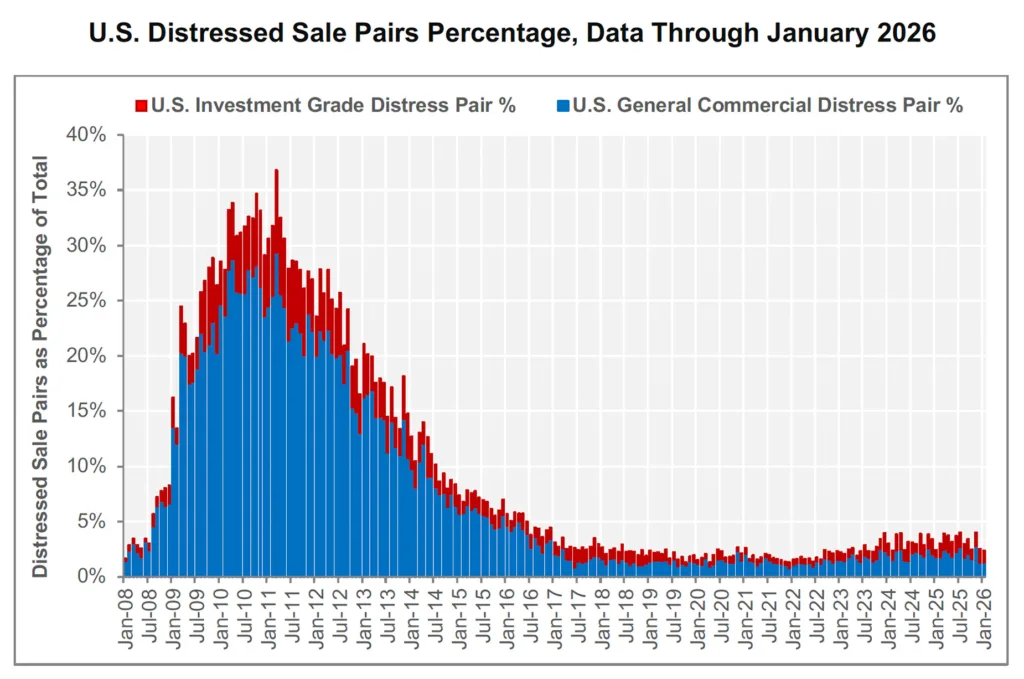
Total commercial repeat-sale transactions for the trailing 12 months reached $146.8B, a 19.9% increase over the previous year, driven largely by secondary and tertiary market deals. However, the number of repeat sales in January fell 10.4% year-over-year, and buyers enjoyed greater discounts—average price-to-asking ratios dropped to 92.5%. Distressed sales remained a small share of all transactions at 2.4%.
Market Outlook Remains Uncertain
Small town commercial assets showed resilience in January. However, CoStar analysts caution that this divergence may not last. Potential Federal Reserve rate cuts could shift market trends later in 2026.
Meanwhile, the average time on market fell slightly to 174 days. At the same time, more sellers pulled listings from the market. These moves reflect continued caution among buyers and sellers navigating shifting CRE conditions nationwide.